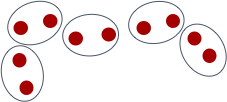
These two configurations are constructed from the same three red dots, but they are perceived quite differently:

 How does the brain do that?
Perceptual organization is a collection of cognitive processes that lead individual pieces of visual input to form a coherent percept.
OK, that’s a lot to digest, so let’s break it down:
Visual input - whatever is out there in the world that our eyes make note of, for example colors, lights, shades, locations, shapes, lines, corners, etc.
Coherent percept - something that we perceive as a meaningful whole, for example, a red dot, vertical columns, a 3D cube, an arrow, a house, etc.
Cognitive processes - mental processes that are responsible for creating our internal world. Some of them link us to our external environment, for example, understanding language or knowing whether to pull or push a door open. Others are mainly internal, like making plans or trying to calculate 6*9 in your head.
Perceptual organization - processes that take colors, lines and locations, and use them to construct an internal representation of a house.
Research in the domain of perceptual organization investigates the computations underlying these processes.
Broadly speaking, we investigate two organizational processes - grouping and figure-ground segmentation. Grouping processes determine which elements go together and are segregated from other elements. Figure-ground segmentation, or figural-assignment, refers to the process in which one part of the visual field is designated as the figure, while the rest is designated as a background.
Examples of grouping cues include:
Proximity: elements that are closer together in space are grouped with each other.

Similarity by color: elements that have the same color are grouped with each other.

Similarity by shape: elements that have the same shape are grouped with each other.

Similarity by orientation: elements that have the same orientation are grouped with each other.

Continuity: (also called “good continuation” or “alignment”) elements that follow a certain path are grouped with each other.

Common region: elements that occupy the same region (i.e., enclosed within the same contour) are grouped with each other.
Connectedness: elements that are connected are grouped with each other.

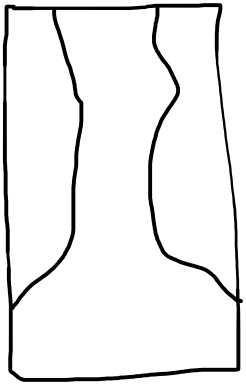
Examples of figural-assignment cues include:
Convexity: a convex area is more likely to be perceived as the figure than a convex area.

Symmetry: a symmetrical area is more likely to be perceived as the figure than an asymmetrical area.
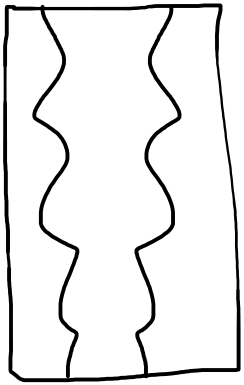
Lower region: the area in the lower region of the visual field is more likely to be perceived as the figure than the area in the upper region.
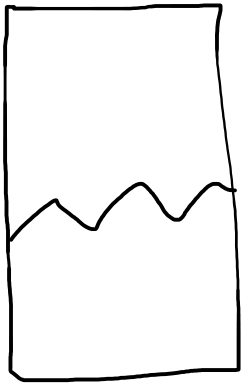
Wide base: an area with a wider base is more likely to be perceived as the figure than an area with a wider top part.